
Coin-op results for USD TRON (TRX)
Here are the latest results for 24/10/2026 17:15 UTC
USD TRON (TRX) at 0.3292 posted a modest fall of -0.13% and is now 12.20% from its previous 12-month maximum end-of-day level ($0.375) posted on the 26/05/2026.
Current capitalization is: $31.22B and the last day's turnover in USD: $294.29M.
Last day's statistics
Change % : -0.0004 / -0.13%
Trading Volatility : 0.40%
Days since signal: 2 / Down -0.13%
MA Direction / Days : Down 15 / -1.02%
Coin-op Summary: As you can see all Coin-op positions are showing 'Down', or Sell
Momentum Strength (1-5): With a momentum of 3, this crypto is lacking impetus at present. This means either there may be a change coming or the market can't work out what to do next.
Regression to the Mean: Normal at -1.31%.
The current Coin-op trigger value (red/green) is currently set at 0.3321

Chart 1
Short term trading: Not only is the 30 day MA trending downwards, but the crypto value is also below the Coin-op line.. So unless you are a short-trader you might want to avoid this for a while.
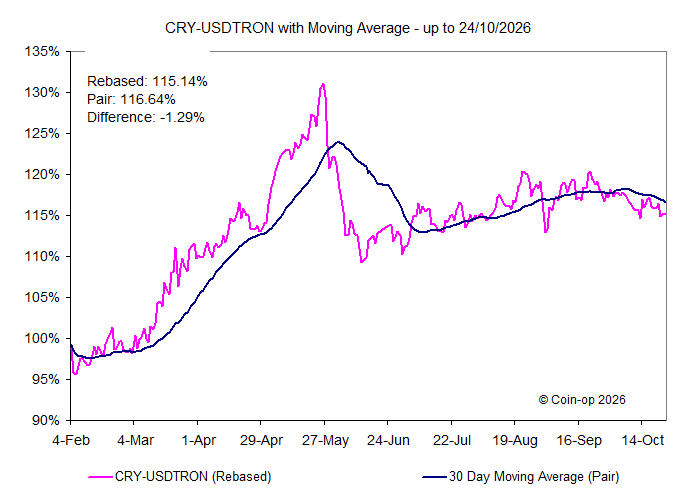
Chart 2
Medium to longer term: Having fallen for 16 days now, a longer downward trend in the 30 day Moving Average is taking shape.
Chart 3
This chart compares the movements of the crypto and those of USD Bitcoin over the last few months.

Chart 4
This chart compares the movements of the crypto and those of the Cryptocurrencies Index over the last few months.
USD TRON (TRX) strives to build the future of a truly decentralized internet and global free content entertainment system that utilizes blockchain technology. The TRON Protocol represents the architecture of an operating system based on the blockchain which could enable developers to create smart contracts and decentralized applications, freely publish, own, and store data and other content.
If you want to read more about this crypto and check out forums and exchanges then look at Coinpaprika for more information.
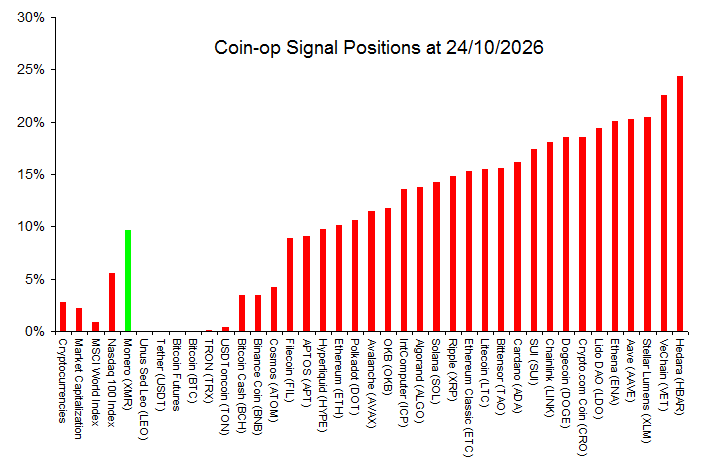 Chart: Current Buy and Sell positions
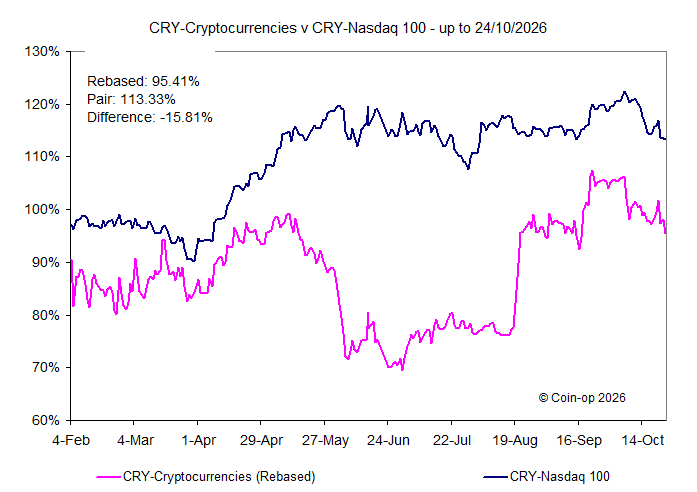 Chart: Coin-op Index vs Nasdaq 100 Index
24/10/2026
Rel Val: 68.18% - Strength: 3
Vol: 2.30% - MA: Down 4 days
Last 3 days: Buys: 1 Sells: 3
Click here to see more ...
Rel Val: 68.48% - Strength: 3
Vol: 1.80% - MA: Down 3 days
Rel Val: 81.99% - Strength: 3
Vol: 0.30% - MA: Down 5 days
Rel Val: 72.01% - Strength: 4
Vol: 1.82% - MA: Down 5 days
Rel Val: 92.42% - Strength: 5
Vol: 1.25% - MA: Up 94 days
Rel Val: 59.60% - Strength: 3
Vol: 0.46% - MA: Up 8 days
Rel Val: 38.10% - Strength: 2
Vol: 0.02% - MA: Down 33 days
Rel Val: 79.42% - Strength: 3
Vol: 1.08% - MA: Down 3 days
Rel Val: 76.03% - Strength: 3
Vol: 1.12% - MA: Down 3 days
Rel Val: 55.00% - Strength: 3
Vol: 0.40% - MA: Down 16 days
Rel Val: 36.42% - Strength: 2
Vol: 0.00% - MA: Down 40 days
Rel Val: 22.18% - Strength: 3
Vol: 4.96% - MA: Down 2 days
Rel Val: 69.86% - Strength: 1
Vol: 2.33% - MA: Down 7 days
Rel Val: 31.74% - Strength: 3
Vol: 2.45% - MA: Down 3 days
Rel Val: 48.33% - Strength: 5
Vol: 0.56% - MA: Up 53 days
Rel Val: 23.68% - Strength: 5
Vol: 0.44% - MA: Up 49 days
Rel Val: 69.97% - Strength: 3
Vol: 4.77% - MA: Down 7 days
Rel Val: 62.39% - Strength: 4
Vol: 3.43% - MA: Down 13 days
Rel Val: 33.80% - Strength: 4
Vol: 2.07% - MA: Down 3 days
Rel Val: 50.55% - Strength: 5
Vol: 4.04% - MA: Down 3 days
Rel Val: 55.51% - Strength: 5
Vol: 3.56% - MA: Down 4 days
Rel Val: 37.25% - Strength: 5
Vol: 3.43% - MA: Down 2 days
Rel Val: 41.89% - Strength: 5
Vol: 3.43% - MA: Down 1 days
Rel Val: 62.77% - Strength: 1
Vol: 5.00% - MA: Down 6 days
Rel Val: 41.65% - Strength: 1
Vol: 4.77% - MA: Down 13 days
Rel Val: 37.03% - Strength: 3
Vol: 4.66% - MA: Down 5 days
Rel Val: 48.90% - Strength: 3
Vol: 5.53% - MA: Down 2 days
Rel Val: 44.27% - Strength: 4
Vol: 4.22% - MA: Down 3 days
Rel Val: 39.08% - Strength: 4
Vol: 5.01% - MA: Down 3 days
Rel Val: 40.16% - Strength: 4
Vol: 5.85% - MA: Up 63 days
Rel Val: 52.29% - Strength: 4
Vol: 5.21% - MA: Down 3 days
Rel Val: 14.23% - Strength: 3
Vol: 5.70% - MA: Down 8 days
Rel Val: 22.51% - Strength: 3
Vol: 5.59% - MA: Down 7 days
Rel Val: 48.39% - Strength: 4
Vol: 5.33% - MA: Down 3 days
Rel Val: 56.41% - Strength: 1
Vol: 8.91% - MA: Down 3 days
Rel Val: 60.97% - Strength: 4
Vol: 5.32% - MA: Up 65 days
Rel Val: 21.29% - Strength: 4
Vol: 6.61% - MA: Down 7 days
Rel Val: 45.20% - Strength: 1
Vol: 8.79% - MA: Down 12 days
Rel Val: 17.35% - Strength: 4
Vol: 7.36% - MA: Down 3 days

Interesting Reads
From the World Economic Forum
New Delhi imposes a temporary ban on odd-numbered vehicles in the city.
This is the brilliance of bicycles in bettering our daily lives.
Economics Nobel Prize 2019 is awarded for 'alleviating global poverty'.
India's seemingly generous maternity law benefits merely 1% of its women.
