
Coin-op results for USD Monero (XMR)
Here are the latest results for 24/10/2026 17:15 UTC
USD Monero (XMR) at 599.60 posted a modest fall of -0.64% and is now 3.91% from its previous 12-month maximum end-of-day level ($623.968) posted on the 20/10/2026.
Current capitalization is: $11.19B and the last day's turnover in USD: $110.40M.
Last day's statistics
Change % : -3.84 / -0.64%
Trading Volatility : 1.25%
Days since signal: 8 / Up 9.68%
MA Direction / Days : Up 93 / 70.42%
Coin-op Summary: All Coin-op signals are green and showing 'Up', or Buy. One thing that could spoil this is if the crypto falls below the Sell limit meaning the market is having second thoughts.
Momentum Strength (1-5): With a 5, this Coin-op momentum measure is running high. Value changes might now be large - watch for sudden reversals.
Regression to the Mean: Normal at 7.07%.
The current Coin-op trigger value (red/green) is currently set at 554.50

Chart 1
Short term trading: The crypto's short term signals and 30 day MA data are all positive at present. It's not guaranteed, of course, but such a scenario often creates the best opportunities for solid trading gains.
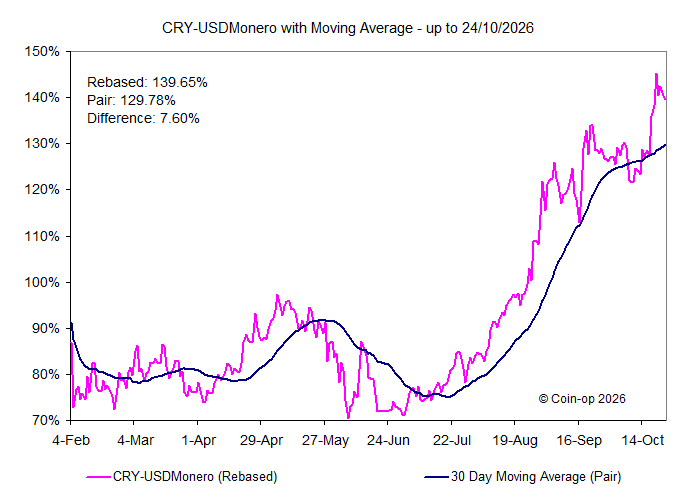
Chart 2
Medium to longer term: With the 30 day Moving Average having run upwards for 94 days, it's clear that good progress has been made.
Chart 3
This chart compares the movements of the crypto and those of USD Bitcoin over the last few months.

Chart 4
This chart compares the movements of the crypto and those of the Cryptocurrencies Index over the last few months.
USD Monero (XMR) is an open-source cryptocurrency created in April 2014 that focuses on fungibility, privacy and decentralization. Monero uses an obfuscated public ledger, meaning anybody can broadcast or send transactions, but no outside observer can tell the source, amount or destination. Monero uses a Proof of Work mechanism to issue new coins and incentivize miners to secure the network and validate transactions.
If you want to read more on its development and history then look at this article in Wikipedia for more information.
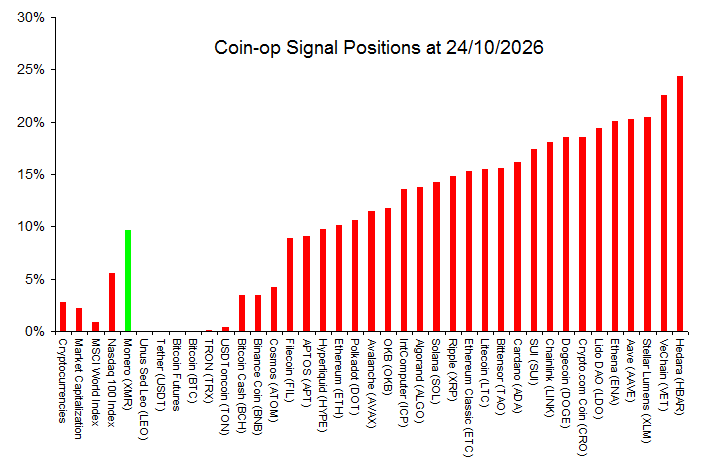 Chart: Current Buy and Sell positions
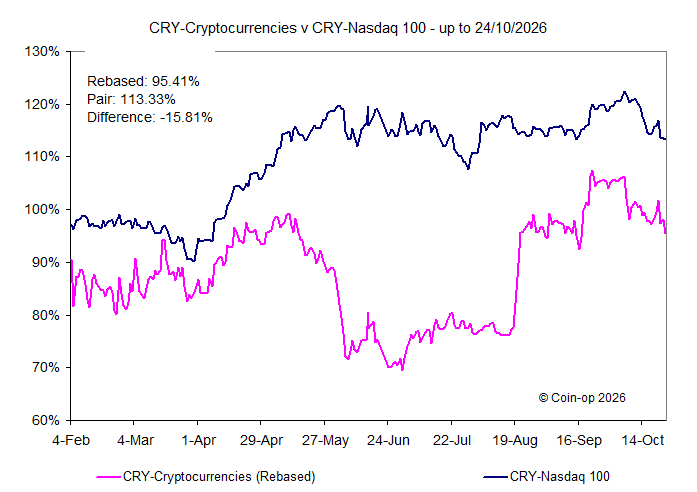 Chart: Coin-op Index vs Nasdaq 100 Index
24/10/2026
Rel Val: 68.18% - Strength: 3
Vol: 2.30% - MA: Down 4 days
Last 3 days: Buys: 1 Sells: 3
Click here to see more ...
Rel Val: 68.48% - Strength: 3
Vol: 1.80% - MA: Down 3 days
Rel Val: 81.99% - Strength: 3
Vol: 0.30% - MA: Down 5 days
Rel Val: 72.01% - Strength: 4
Vol: 1.82% - MA: Down 5 days
Rel Val: 92.42% - Strength: 5
Vol: 1.25% - MA: Up 94 days
Rel Val: 59.60% - Strength: 3
Vol: 0.46% - MA: Up 8 days
Rel Val: 38.10% - Strength: 2
Vol: 0.02% - MA: Down 33 days
Rel Val: 79.42% - Strength: 3
Vol: 1.08% - MA: Down 3 days
Rel Val: 76.03% - Strength: 3
Vol: 1.12% - MA: Down 3 days
Rel Val: 55.00% - Strength: 3
Vol: 0.40% - MA: Down 16 days
Rel Val: 36.42% - Strength: 2
Vol: 0.00% - MA: Down 40 days
Rel Val: 22.18% - Strength: 3
Vol: 4.96% - MA: Down 2 days
Rel Val: 69.86% - Strength: 1
Vol: 2.33% - MA: Down 7 days
Rel Val: 31.74% - Strength: 3
Vol: 2.45% - MA: Down 3 days
Rel Val: 48.33% - Strength: 5
Vol: 0.56% - MA: Up 53 days
Rel Val: 23.68% - Strength: 5
Vol: 0.44% - MA: Up 49 days
Rel Val: 69.97% - Strength: 3
Vol: 4.77% - MA: Down 7 days
Rel Val: 62.39% - Strength: 4
Vol: 3.43% - MA: Down 13 days
Rel Val: 33.80% - Strength: 4
Vol: 2.07% - MA: Down 3 days
Rel Val: 50.55% - Strength: 5
Vol: 4.04% - MA: Down 3 days
Rel Val: 55.51% - Strength: 5
Vol: 3.56% - MA: Down 4 days
Rel Val: 37.25% - Strength: 5
Vol: 3.43% - MA: Down 2 days
Rel Val: 41.89% - Strength: 5
Vol: 3.43% - MA: Down 1 days
Rel Val: 62.77% - Strength: 1
Vol: 5.00% - MA: Down 6 days
Rel Val: 41.65% - Strength: 1
Vol: 4.77% - MA: Down 13 days
Rel Val: 37.03% - Strength: 3
Vol: 4.66% - MA: Down 5 days
Rel Val: 48.90% - Strength: 3
Vol: 5.53% - MA: Down 2 days
Rel Val: 44.27% - Strength: 4
Vol: 4.22% - MA: Down 3 days
Rel Val: 39.08% - Strength: 4
Vol: 5.01% - MA: Down 3 days
Rel Val: 40.16% - Strength: 4
Vol: 5.85% - MA: Up 63 days
Rel Val: 52.29% - Strength: 4
Vol: 5.21% - MA: Down 3 days
Rel Val: 14.23% - Strength: 3
Vol: 5.70% - MA: Down 8 days
Rel Val: 22.51% - Strength: 3
Vol: 5.59% - MA: Down 7 days
Rel Val: 48.39% - Strength: 4
Vol: 5.33% - MA: Down 3 days
Rel Val: 56.41% - Strength: 1
Vol: 8.91% - MA: Down 3 days
Rel Val: 60.97% - Strength: 4
Vol: 5.32% - MA: Up 65 days
Rel Val: 21.29% - Strength: 4
Vol: 6.61% - MA: Down 7 days
Rel Val: 45.20% - Strength: 1
Vol: 8.79% - MA: Down 12 days
Rel Val: 17.35% - Strength: 4
Vol: 7.36% - MA: Down 3 days

Interesting Reads
From the World Economic Forum
Indonesia is setting the example for how to fight forest fires.
Cities around the world are looking to get quieter and more peaceful.
This pioneering British 'wildland' estate could boost biodiversity and yields.
This is the world's longest passenger flight.
When it comes to gender equality, banks need to walk their talk.
