
Coin-op results for USD Aave (AAVE)
Here are the latest results for 24/10/2026 17:15 UTC
USD Aave (AAVE) had a severe fall of -8.67% over the market session to close at 135.310 and is now 26.16% from its previous 12-month maximum end-of-day level ($183.250) posted on the 05/10/2026.
Current capitalization is: $2.08B and the last day's turnover in USD: $227.76M.
Last day's statistics
Change % : -12.840 / -8.67%
Trading Volatility : 5.32%
Days since signal: 14 / Down -20.28%
MA Direction / Days : Up 64 / 20.36%
Coin-op Summary: With three Sell signals and a trailing MA it's difficult to be positive about this crypto at present. If the MA does turn downwards soon that's a full set of Sell signals.
Momentum Strength (1-5): At 4, the short-term momentum for this crypto is looking good. This should lead to clearer trading movements - both up and down.
Regression to the Mean: High at -19.26% - the fall could be overdone so a bounce back is possible.
The current Coin-op trigger value (red/green) is currently set at 155.125

Chart 1
Short term trading: All the short term values are in Sell territory today; only the 30 day MA is still trending upwards. Unless the market reverses, the 30 day MA will eventually join the other Sell signals.
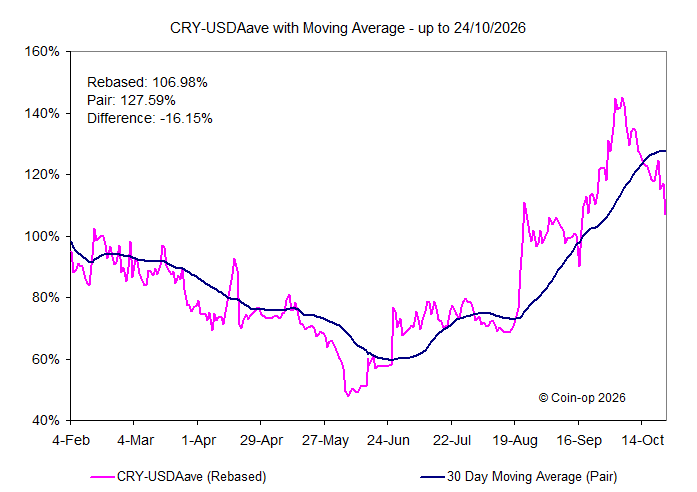
Chart 2
Medium to longer term: The 30 day Moving Average has now been rising for 65 days and a moderate improvement is becoming a significant one. But some warning needed here; the security is now trading -19.26% below its MA.
Chart 3
This chart compares the movements of the crypto and those of e v USD Bitcoin over the last few months.

Chart 4
This chart compares the movements of the crypto and those of the Cryptocurrencies Index over the last few months.
USD Aave (AAVE) On 15 November 2018, a hard-fork chain split of Bitcoin Cash occurred between two rival factions called Bitcoin Cash and Bitcoin SV. On 15 November 2018 Bitcoin Cash ABC traded at about $289 and Bitcoin SV traded at about $96.50, down from $425.01 on 14 November for the un-split Bitcoin Cash.
If you want to read more on its development and history then look at this article in Wikipedia for more information.
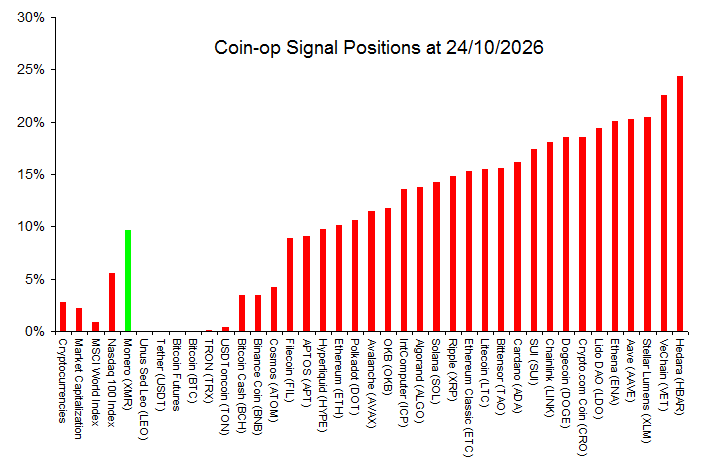 Chart: Current Buy and Sell positions
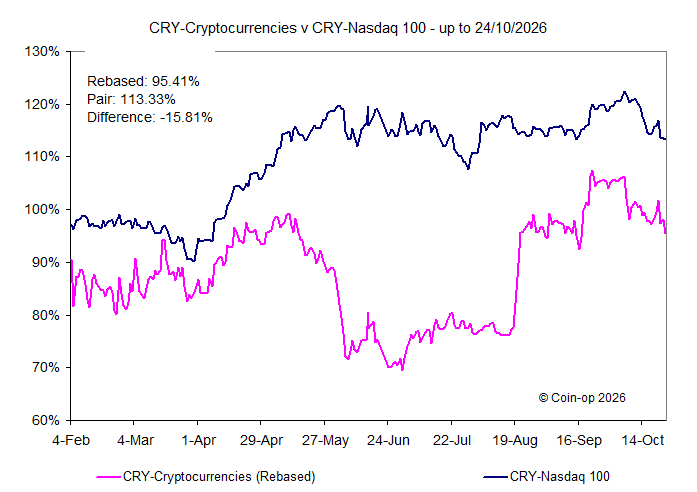 Chart: Coin-op Index vs Nasdaq 100 Index
24/10/2026
Rel Val: 68.18% - Strength: 3
Vol: 2.30% - MA: Down 4 days
Last 3 days: Buys: 1 Sells: 3
Click here to see more ...
Rel Val: 68.48% - Strength: 3
Vol: 1.80% - MA: Down 3 days
Rel Val: 81.99% - Strength: 3
Vol: 0.30% - MA: Down 5 days
Rel Val: 72.01% - Strength: 4
Vol: 1.82% - MA: Down 5 days
Rel Val: 92.42% - Strength: 5
Vol: 1.25% - MA: Up 94 days
Rel Val: 59.60% - Strength: 3
Vol: 0.46% - MA: Up 8 days
Rel Val: 38.10% - Strength: 2
Vol: 0.02% - MA: Down 33 days
Rel Val: 79.42% - Strength: 3
Vol: 1.08% - MA: Down 3 days
Rel Val: 76.03% - Strength: 3
Vol: 1.12% - MA: Down 3 days
Rel Val: 55.00% - Strength: 3
Vol: 0.40% - MA: Down 16 days
Rel Val: 36.42% - Strength: 2
Vol: 0.00% - MA: Down 40 days
Rel Val: 22.18% - Strength: 3
Vol: 4.96% - MA: Down 2 days
Rel Val: 69.86% - Strength: 1
Vol: 2.33% - MA: Down 7 days
Rel Val: 31.74% - Strength: 3
Vol: 2.45% - MA: Down 3 days
Rel Val: 48.33% - Strength: 5
Vol: 0.56% - MA: Up 53 days
Rel Val: 23.68% - Strength: 5
Vol: 0.44% - MA: Up 49 days
Rel Val: 69.97% - Strength: 3
Vol: 4.77% - MA: Down 7 days
Rel Val: 62.39% - Strength: 4
Vol: 3.43% - MA: Down 13 days
Rel Val: 33.80% - Strength: 4
Vol: 2.07% - MA: Down 3 days
Rel Val: 50.55% - Strength: 5
Vol: 4.04% - MA: Down 3 days
Rel Val: 55.51% - Strength: 5
Vol: 3.56% - MA: Down 4 days
Rel Val: 37.25% - Strength: 5
Vol: 3.43% - MA: Down 2 days
Rel Val: 41.89% - Strength: 5
Vol: 3.43% - MA: Down 1 days
Rel Val: 62.77% - Strength: 1
Vol: 5.00% - MA: Down 6 days
Rel Val: 41.65% - Strength: 1
Vol: 4.77% - MA: Down 13 days
Rel Val: 37.03% - Strength: 3
Vol: 4.66% - MA: Down 5 days
Rel Val: 48.90% - Strength: 3
Vol: 5.53% - MA: Down 2 days
Rel Val: 44.27% - Strength: 4
Vol: 4.22% - MA: Down 3 days
Rel Val: 39.08% - Strength: 4
Vol: 5.01% - MA: Down 3 days
Rel Val: 40.16% - Strength: 4
Vol: 5.85% - MA: Up 63 days
Rel Val: 52.29% - Strength: 4
Vol: 5.21% - MA: Down 3 days
Rel Val: 14.23% - Strength: 3
Vol: 5.70% - MA: Down 8 days
Rel Val: 22.51% - Strength: 3
Vol: 5.59% - MA: Down 7 days
Rel Val: 48.39% - Strength: 4
Vol: 5.33% - MA: Down 3 days
Rel Val: 56.41% - Strength: 1
Vol: 8.91% - MA: Down 3 days
Rel Val: 60.97% - Strength: 4
Vol: 5.32% - MA: Up 65 days
Rel Val: 21.29% - Strength: 4
Vol: 6.61% - MA: Down 7 days
Rel Val: 45.20% - Strength: 1
Vol: 8.79% - MA: Down 12 days
Rel Val: 17.35% - Strength: 4
Vol: 7.36% - MA: Down 3 days

