
Coin-op results for USD Polkadot (DOT)
Here are the latest results for 24/10/2026 17:15 UTC
USD Polkadot (DOT) had a severe fall of -7.64% over the market session to close at 1.04 and is now 35.51% from its previous 12-month maximum end-of-day level ($1.611) posted on the 16/03/2026.
Current capitalization is: $1.77B and the last day's turnover in USD: $117.13M.
Last day's statistics
Change % : -0.09 / -7.64%
Trading Volatility : 2.07%
Days since signal: 12 / Down -10.59%
MA Direction / Days : Down 2 / -7.31%
Coin-op Summary: All the crypto's Coin-op positions are set at Sell
Momentum Strength (1-5): At 4, the momentum for this crypto is in a lively range. But this means trading values can fall and rise further.
Regression to the Mean: Normal at -12.60%.
The current Coin-op trigger value (red/green) is currently set at 1.14

Chart 1
Short term trading: Not only is the 30 day MA trending downwards, but the crypto value is also below the Coin-op line.. Until things improve maybe look elsewhere?
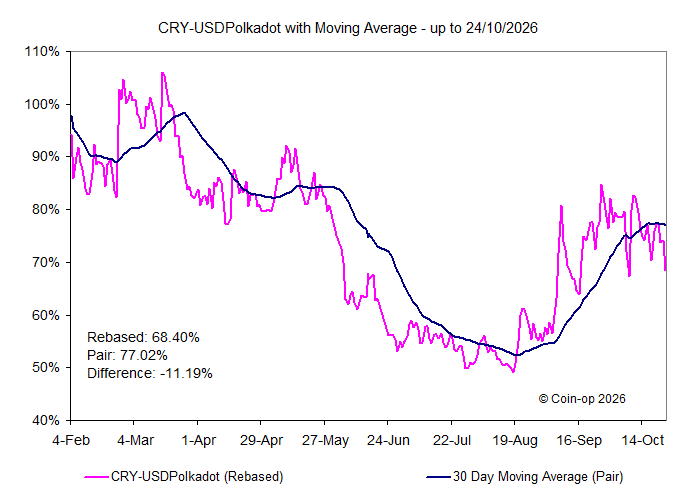
Chart 2
Medium to longer term: Look out for the 30 day Moving Average which turned downwards 3 days ago and which we said could be the first stage in a longer term change of trend. Still a way to go but if a downward trend gets a grip in the next few weeks it could seriously affect values.
Chart 3
This chart compares the movements of the crypto and those of USD Bitcoin over the last few months.

Chart 4
This chart compares the movements of the crypto and those of the Cryptocurrencies Index over the last few months.
USD Polkadot (DOT) is an open source, blockchain platform and cryptocurrency.[1] It provides interconnectivity and interoperability between blockchains, by enabling independent chains to securely exchange messages and perform transactions with each other without trusted third-party. This allows for cross-chain transfers of data or assets, between different blockchains ...
If you want to read more on its development and history then look at this article in Wikipedia for more information.
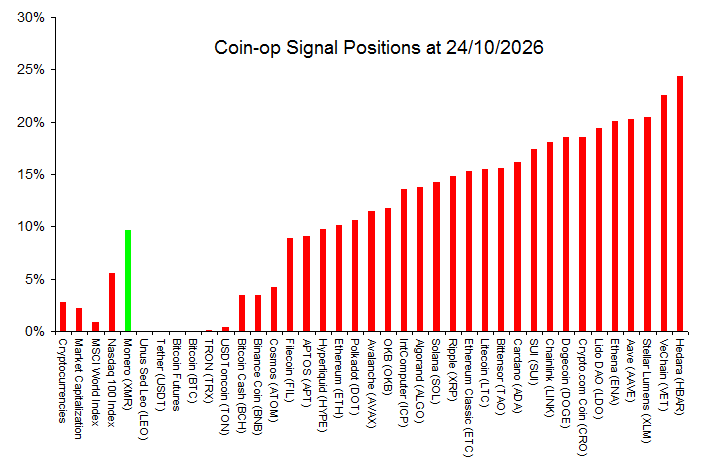 Chart: Current Buy and Sell positions
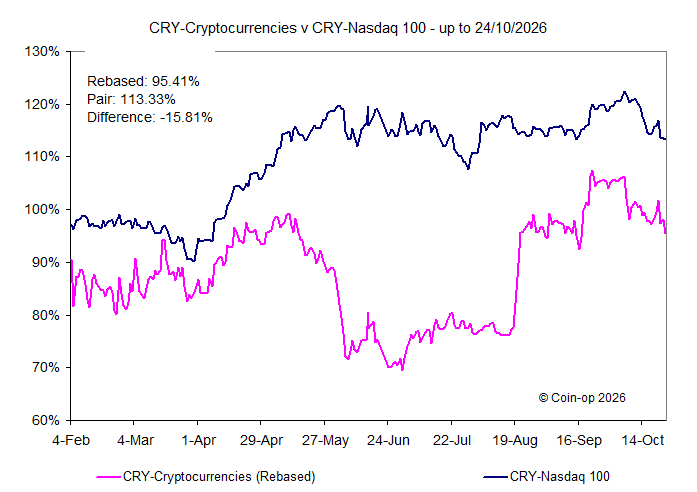 Chart: Coin-op Index vs Nasdaq 100 Index
24/10/2026
Rel Val: 68.18% - Strength: 3
Vol: 2.30% - MA: Down 4 days
Last 3 days: Buys: 1 Sells: 3
Click here to see more ...
Rel Val: 68.48% - Strength: 3
Vol: 1.80% - MA: Down 3 days
Rel Val: 81.99% - Strength: 3
Vol: 0.30% - MA: Down 5 days
Rel Val: 72.01% - Strength: 4
Vol: 1.82% - MA: Down 5 days
Rel Val: 92.42% - Strength: 5
Vol: 1.25% - MA: Up 94 days
Rel Val: 59.60% - Strength: 3
Vol: 0.46% - MA: Up 8 days
Rel Val: 38.10% - Strength: 2
Vol: 0.02% - MA: Down 33 days
Rel Val: 79.42% - Strength: 3
Vol: 1.08% - MA: Down 3 days
Rel Val: 76.03% - Strength: 3
Vol: 1.12% - MA: Down 3 days
Rel Val: 55.00% - Strength: 3
Vol: 0.40% - MA: Down 16 days
Rel Val: 36.42% - Strength: 2
Vol: 0.00% - MA: Down 40 days
Rel Val: 22.18% - Strength: 3
Vol: 4.96% - MA: Down 2 days
Rel Val: 69.86% - Strength: 1
Vol: 2.33% - MA: Down 7 days
Rel Val: 31.74% - Strength: 3
Vol: 2.45% - MA: Down 3 days
Rel Val: 48.33% - Strength: 5
Vol: 0.56% - MA: Up 53 days
Rel Val: 23.68% - Strength: 5
Vol: 0.44% - MA: Up 49 days
Rel Val: 69.97% - Strength: 3
Vol: 4.77% - MA: Down 7 days
Rel Val: 62.39% - Strength: 4
Vol: 3.43% - MA: Down 13 days
Rel Val: 33.80% - Strength: 4
Vol: 2.07% - MA: Down 3 days
Rel Val: 50.55% - Strength: 5
Vol: 4.04% - MA: Down 3 days
Rel Val: 55.51% - Strength: 5
Vol: 3.56% - MA: Down 4 days
Rel Val: 37.25% - Strength: 5
Vol: 3.43% - MA: Down 2 days
Rel Val: 41.89% - Strength: 5
Vol: 3.43% - MA: Down 1 days
Rel Val: 62.77% - Strength: 1
Vol: 5.00% - MA: Down 6 days
Rel Val: 41.65% - Strength: 1
Vol: 4.77% - MA: Down 13 days
Rel Val: 37.03% - Strength: 3
Vol: 4.66% - MA: Down 5 days
Rel Val: 48.90% - Strength: 3
Vol: 5.53% - MA: Down 2 days
Rel Val: 44.27% - Strength: 4
Vol: 4.22% - MA: Down 3 days
Rel Val: 39.08% - Strength: 4
Vol: 5.01% - MA: Down 3 days
Rel Val: 40.16% - Strength: 4
Vol: 5.85% - MA: Up 63 days
Rel Val: 52.29% - Strength: 4
Vol: 5.21% - MA: Down 3 days
Rel Val: 14.23% - Strength: 3
Vol: 5.70% - MA: Down 8 days
Rel Val: 22.51% - Strength: 3
Vol: 5.59% - MA: Down 7 days
Rel Val: 48.39% - Strength: 4
Vol: 5.33% - MA: Down 3 days
Rel Val: 56.41% - Strength: 1
Vol: 8.91% - MA: Down 3 days
Rel Val: 60.97% - Strength: 4
Vol: 5.32% - MA: Up 65 days
Rel Val: 21.29% - Strength: 4
Vol: 6.61% - MA: Down 7 days
Rel Val: 45.20% - Strength: 1
Vol: 8.79% - MA: Down 12 days
Rel Val: 17.35% - Strength: 4
Vol: 7.36% - MA: Down 3 days

Interesting Reads
From the World Economic Forum
These are the UK's biggest trading partners.
Here's why business strategists aren't focusing enough on communications.
Our cities are woefully unprepared for the threat of climate change.
There's a glimmer of hope for peace in Eastern Ukraine. Here's what needs to happen now.
