
Coin-op results for USD SUI (SUI)
Here are the latest results for 24/10/2026 17:15 UTC
USD SUI (SUI) had a severe fall of -6.63% over the market session to close at 0.9244 and is now 30.34% from its previous 12-month maximum end-of-day level ($1.327) posted on the 10/05/2026.
Current capitalization is: $3.80B and the last day's turnover in USD: $398.49M.
Last day's statistics
Change % : -0.0656 / -6.63%
Trading Volatility : 5.85%
Days since signal: 18 / Down -17.38%
MA Direction / Days : Up 62 / 12.02%
Coin-op Summary: With three Sell signals and a trailing MA it's difficult to be positive about this crypto at present. If the MA does turn downwards soon that's a full set of Sell signals.
Momentum Strength (1-5): At 4, the short-term momentum for this crypto is looking good. This means trading short term should now produce clear results, both up and down.
Regression to the Mean: High at -17.79% - the fall could be overdone so a bounce back is possible.
The current Coin-op trigger value (red/green) is currently set at 1.0157

Chart 1
Short term trading: All the short term values are in Sell territory today; only the 30 day MA is still trending upwards. If things continue like this the MA should soon join the others in a full-house of Sell signals.
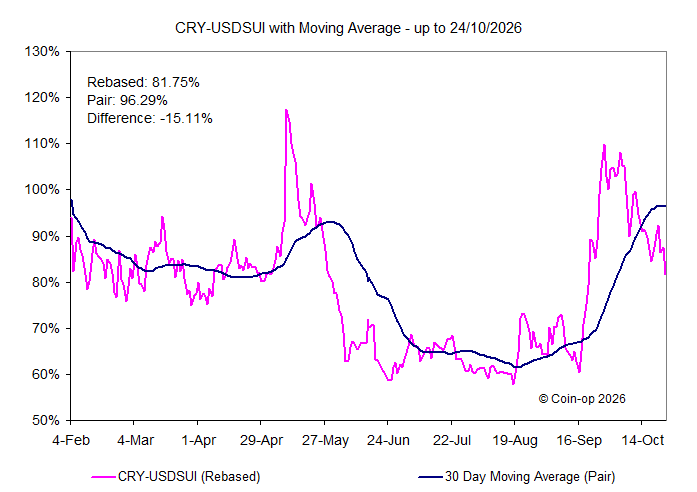
Chart 2
Medium to longer term: Having risen for 63 days now, the 30 day Moving Average is indicating that things are extremely promising. This is good whilst the MA continues on this course however the security is now trading -17.79% below its MA so this might not last.
Chart 3
This chart compares the movements of the crypto and those of USD Bitcoin over the last few months.

Chart 4
This chart compares the movements of the crypto and those of the Cryptocurrencies Index over the last few months.
USD SUI (SUI) no data
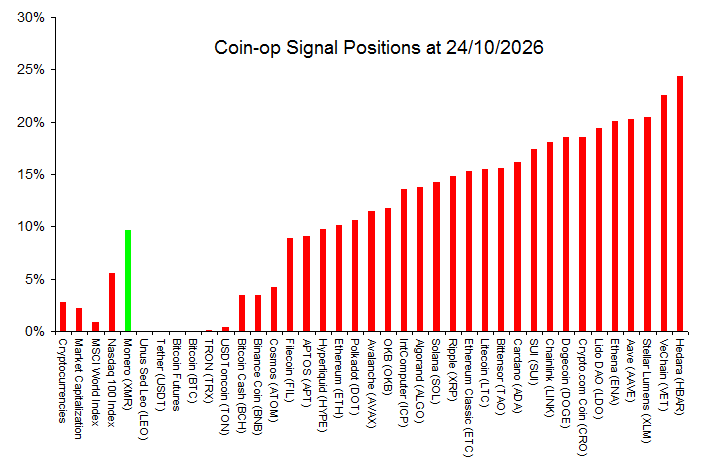 Chart: Current Buy and Sell positions
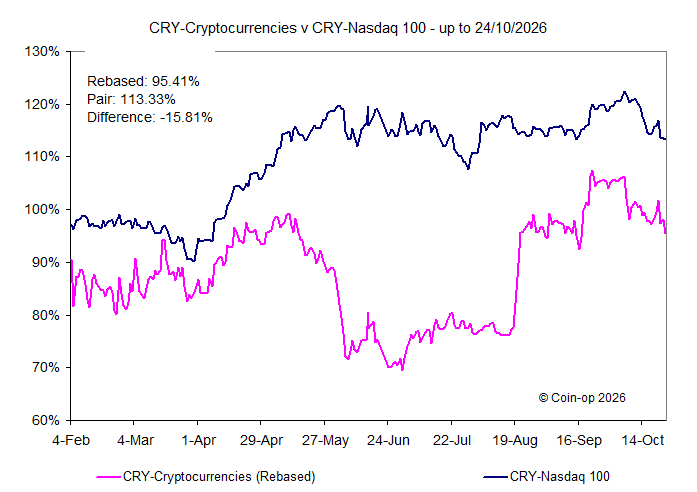 Chart: Coin-op Index vs Nasdaq 100 Index
24/10/2026
Rel Val: 68.18% - Strength: 3
Vol: 2.30% - MA: Down 4 days
Last 3 days: Buys: 1 Sells: 3
Click here to see more ...
Rel Val: 68.48% - Strength: 3
Vol: 1.80% - MA: Down 3 days
Rel Val: 81.99% - Strength: 3
Vol: 0.30% - MA: Down 5 days
Rel Val: 72.01% - Strength: 4
Vol: 1.82% - MA: Down 5 days
Rel Val: 92.42% - Strength: 5
Vol: 1.25% - MA: Up 94 days
Rel Val: 59.60% - Strength: 3
Vol: 0.46% - MA: Up 8 days
Rel Val: 38.10% - Strength: 2
Vol: 0.02% - MA: Down 33 days
Rel Val: 79.42% - Strength: 3
Vol: 1.08% - MA: Down 3 days
Rel Val: 76.03% - Strength: 3
Vol: 1.12% - MA: Down 3 days
Rel Val: 55.00% - Strength: 3
Vol: 0.40% - MA: Down 16 days
Rel Val: 36.42% - Strength: 2
Vol: 0.00% - MA: Down 40 days
Rel Val: 22.18% - Strength: 3
Vol: 4.96% - MA: Down 2 days
Rel Val: 69.86% - Strength: 1
Vol: 2.33% - MA: Down 7 days
Rel Val: 31.74% - Strength: 3
Vol: 2.45% - MA: Down 3 days
Rel Val: 48.33% - Strength: 5
Vol: 0.56% - MA: Up 53 days
Rel Val: 23.68% - Strength: 5
Vol: 0.44% - MA: Up 49 days
Rel Val: 69.97% - Strength: 3
Vol: 4.77% - MA: Down 7 days
Rel Val: 62.39% - Strength: 4
Vol: 3.43% - MA: Down 13 days
Rel Val: 33.80% - Strength: 4
Vol: 2.07% - MA: Down 3 days
Rel Val: 50.55% - Strength: 5
Vol: 4.04% - MA: Down 3 days
Rel Val: 55.51% - Strength: 5
Vol: 3.56% - MA: Down 4 days
Rel Val: 37.25% - Strength: 5
Vol: 3.43% - MA: Down 2 days
Rel Val: 41.89% - Strength: 5
Vol: 3.43% - MA: Down 1 days
Rel Val: 62.77% - Strength: 1
Vol: 5.00% - MA: Down 6 days
Rel Val: 41.65% - Strength: 1
Vol: 4.77% - MA: Down 13 days
Rel Val: 37.03% - Strength: 3
Vol: 4.66% - MA: Down 5 days
Rel Val: 48.90% - Strength: 3
Vol: 5.53% - MA: Down 2 days
Rel Val: 44.27% - Strength: 4
Vol: 4.22% - MA: Down 3 days
Rel Val: 39.08% - Strength: 4
Vol: 5.01% - MA: Down 3 days
Rel Val: 40.16% - Strength: 4
Vol: 5.85% - MA: Up 63 days
Rel Val: 52.29% - Strength: 4
Vol: 5.21% - MA: Down 3 days
Rel Val: 14.23% - Strength: 3
Vol: 5.70% - MA: Down 8 days
Rel Val: 22.51% - Strength: 3
Vol: 5.59% - MA: Down 7 days
Rel Val: 48.39% - Strength: 4
Vol: 5.33% - MA: Down 3 days
Rel Val: 56.41% - Strength: 1
Vol: 8.91% - MA: Down 3 days
Rel Val: 60.97% - Strength: 4
Vol: 5.32% - MA: Up 65 days
Rel Val: 21.29% - Strength: 4
Vol: 6.61% - MA: Down 7 days
Rel Val: 45.20% - Strength: 1
Vol: 8.79% - MA: Down 12 days
Rel Val: 17.35% - Strength: 4
Vol: 7.36% - MA: Down 3 days

Interesting Reads
From the World Economic Forum
This is why women in management positions are facing discrimination.
Millennials are the first UK 30-somethings to earn less than past generations.
Onagawa's spirit of togetherness: lessons from the 2011 tsunami.
U.S. dairy farmers dump milk as pandemic upends food markets.
