
Coin-op results for USD Bitcoin Cash (BCH)
Here are the latest results for 24/10/2026 17:15 UTC
USD Bitcoin Cash (BCH) had a severe fall of -6.32% over the market session to close at 269.26 and is now 52.97% from its previous 12-month maximum end-of-day level ($572.490) posted on the 22/02/2026.
Current capitalization is: $5.42B and the last day's turnover in USD: $155.49M.
Last day's statistics
Change % : -18.15 / -6.32%
Trading Volatility : 4.96%
Days since signal: 5 / Down -3.42%
MA Direction / Days : Down 1 / -6.32%
Coin-op Summary: Despite the crypto currently being below the line, a Coin-op Buy signal is in place However the MA crossover and the MA direction, are still set at Sell, so keep an eye on where the crypto goes next.
Momentum Strength (1-5): At 3, this crypto is showing some signs of a slowdown. This means either there may be a change coming or the market can't work out what to do next.
Regression to the Mean: Normal at -9.12%.
The current Coin-op trigger value (red/green) is currently set at 273.88

Chart 1
Short term trading: One of those strange situations where the crypto is showing a Coin-op Buy but the other values are trending down. This implies that the market is uncertain as to where to go next so keep an eye on it for a while.
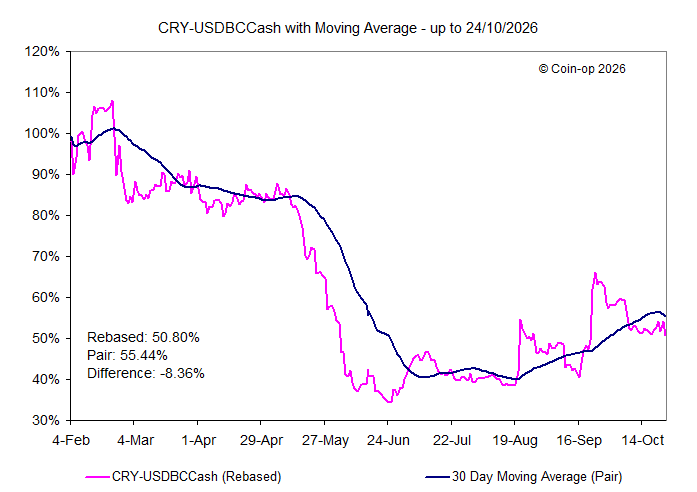
Chart 2
Medium to longer term: Look out for the 30 day Moving Average which turned downwards 2 days ago and which we said could be the first stage in a longer term change of trend. Still a way to go but if a downward trend gets a grip in the next few weeks it could seriously affect values.
Chart 3
This chart compares the movements of the crypto and those of USD Bitcoin over the last few months.

Chart 4
This chart compares the movements of the crypto and those of the Cryptocurrencies Index over the last few months.
USD Bitcoin Cash (BCH) is a cryptocurrency. It is a hard fork of the cryptocurrency bitcoin. The bitcoin scalability debate led to the hard fork on August 1, 2017, which resulted in the creation of a new blockchain
If you want to read more on its development and history then look at this article in Wikipedia for more information.
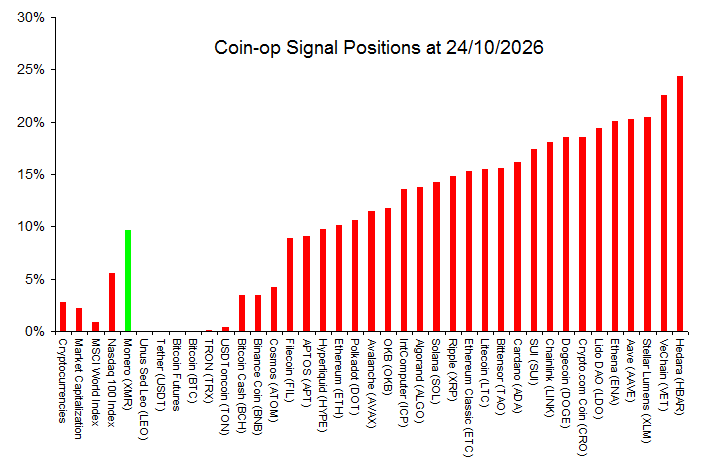 Chart: Current Buy and Sell positions
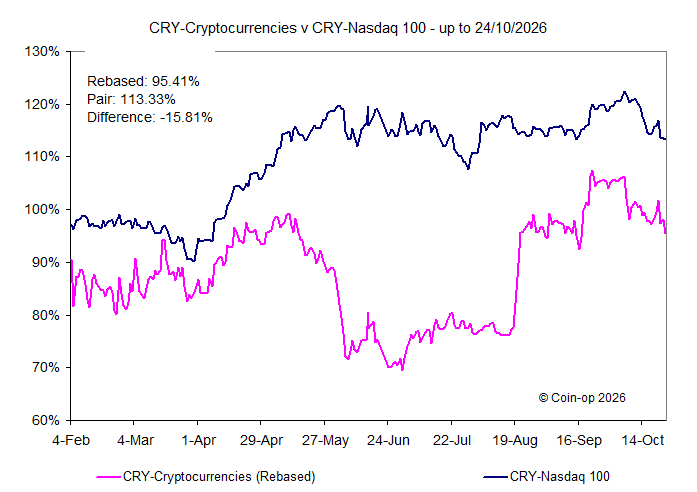 Chart: Coin-op Index vs Nasdaq 100 Index
24/10/2026
Rel Val: 68.18% - Strength: 3
Vol: 2.30% - MA: Down 4 days
Last 3 days: Buys: 1 Sells: 3
Click here to see more ...
Rel Val: 68.48% - Strength: 3
Vol: 1.80% - MA: Down 3 days
Rel Val: 81.99% - Strength: 3
Vol: 0.30% - MA: Down 5 days
Rel Val: 72.01% - Strength: 4
Vol: 1.82% - MA: Down 5 days
Rel Val: 92.42% - Strength: 5
Vol: 1.25% - MA: Up 94 days
Rel Val: 59.60% - Strength: 3
Vol: 0.46% - MA: Up 8 days
Rel Val: 38.10% - Strength: 2
Vol: 0.02% - MA: Down 33 days
Rel Val: 79.42% - Strength: 3
Vol: 1.08% - MA: Down 3 days
Rel Val: 76.03% - Strength: 3
Vol: 1.12% - MA: Down 3 days
Rel Val: 55.00% - Strength: 3
Vol: 0.40% - MA: Down 16 days
Rel Val: 36.42% - Strength: 2
Vol: 0.00% - MA: Down 40 days
Rel Val: 22.18% - Strength: 3
Vol: 4.96% - MA: Down 2 days
Rel Val: 69.86% - Strength: 1
Vol: 2.33% - MA: Down 7 days
Rel Val: 31.74% - Strength: 3
Vol: 2.45% - MA: Down 3 days
Rel Val: 48.33% - Strength: 5
Vol: 0.56% - MA: Up 53 days
Rel Val: 23.68% - Strength: 5
Vol: 0.44% - MA: Up 49 days
Rel Val: 69.97% - Strength: 3
Vol: 4.77% - MA: Down 7 days
Rel Val: 62.39% - Strength: 4
Vol: 3.43% - MA: Down 13 days
Rel Val: 33.80% - Strength: 4
Vol: 2.07% - MA: Down 3 days
Rel Val: 50.55% - Strength: 5
Vol: 4.04% - MA: Down 3 days
Rel Val: 55.51% - Strength: 5
Vol: 3.56% - MA: Down 4 days
Rel Val: 37.25% - Strength: 5
Vol: 3.43% - MA: Down 2 days
Rel Val: 41.89% - Strength: 5
Vol: 3.43% - MA: Down 1 days
Rel Val: 62.77% - Strength: 1
Vol: 5.00% - MA: Down 6 days
Rel Val: 41.65% - Strength: 1
Vol: 4.77% - MA: Down 13 days
Rel Val: 37.03% - Strength: 3
Vol: 4.66% - MA: Down 5 days
Rel Val: 48.90% - Strength: 3
Vol: 5.53% - MA: Down 2 days
Rel Val: 44.27% - Strength: 4
Vol: 4.22% - MA: Down 3 days
Rel Val: 39.08% - Strength: 4
Vol: 5.01% - MA: Down 3 days
Rel Val: 40.16% - Strength: 4
Vol: 5.85% - MA: Up 63 days
Rel Val: 52.29% - Strength: 4
Vol: 5.21% - MA: Down 3 days
Rel Val: 14.23% - Strength: 3
Vol: 5.70% - MA: Down 8 days
Rel Val: 22.51% - Strength: 3
Vol: 5.59% - MA: Down 7 days
Rel Val: 48.39% - Strength: 4
Vol: 5.33% - MA: Down 3 days
Rel Val: 56.41% - Strength: 1
Vol: 8.91% - MA: Down 3 days
Rel Val: 60.97% - Strength: 4
Vol: 5.32% - MA: Up 65 days
Rel Val: 21.29% - Strength: 4
Vol: 6.61% - MA: Down 7 days
Rel Val: 45.20% - Strength: 1
Vol: 8.79% - MA: Down 12 days
Rel Val: 17.35% - Strength: 4
Vol: 7.36% - MA: Down 3 days

Interesting Reads
From the World Economic Forum
A brief history of globalization.
These measures stopped interest rates from falling even further.
The devastation of Australian bushfires in pictures.
This VR game brings touch, heat and scent into the gaming industry.
This disease once wiped out 60% of Europe's population - and now it's back.
